Server-Timings: Rails performance metrics in your dev tools
If you use the browser development tools, you've likely seen the request timing information on the Network tab. It shows how long it takes for web pages and their components to load. But did you know that servers can also send their own timing information? They can do this with a header named Server-Timing. Modern browsers can show the server timing data next to the client timing data on the Network tab. This can help developers find and fix server-side performance issues such as N+1 queries. You can read more about the Server-Timing header's specification in the W3 working draft, or on Mozilla’s documentation site
Finding the Server-Timing information
There are two ways to find the data (skip this section if you’re already a Network tab aficionado). Both require one to visit the Network tab in the browser developer tools. First, refresh the page to make sure the request you want to look at is shown. Then click that request and choose the “Timings” tab for it. If the server you're looking at sends timing information in its headers you'll usually see it beneath the client-side information. In some browsers, you can also hover over the timing section and see a quick pop-out with the same data. Keep in mind, not all servers send this information and in Rails you won’t see timing information for assets so make sure you’re looking at an actual page load or AJAX request.

If the server isn't sending timing information you’ll either see nothing (Firefox) or you may see an informative message like:

Using Server-Timings with Rails
Rails added support for timing information with the release of Rails 7, though the feature didn’t get much attention. The PR for this had been in progress for several years and was originally a proposal for GSOC 2018. It does not apply to serving assets like JS and images, so you’ll only see it for responses sent by regular MVC Controllers. That’s probably all you need anyway since you’re likely using a CDN for assets in production.
Production Usage
By default, the middleware that adds the Server-Timings header is enabled in development mode only. (Server-Timings, like any instrumentation, can itself affect performance.) You can however easily enable it in production by setting config.server_timing = true in your environments/production.rb file. I prefer to do this with an environment variable so that I can enable it in a UAT or staging environments and not in all my production-level environments.
config.server_timing = ENV["SERVER_TIMING"].present?
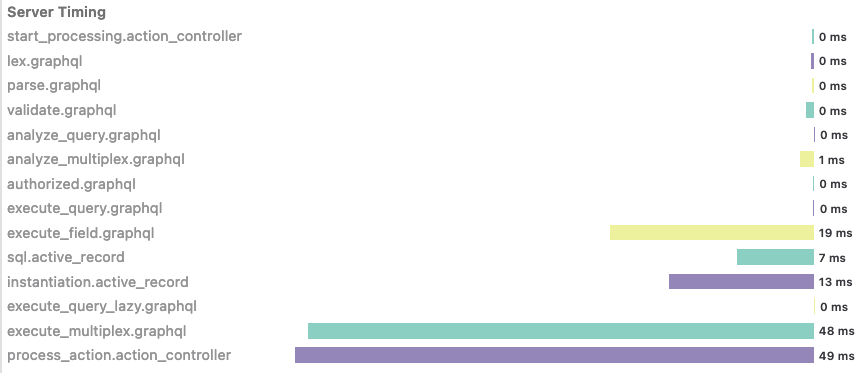
It's timing turtles all the way down
If you sum up the data from Rails Server-Timings it won’t equal the total request time. There’s a good reason for this, the controller calls methods that may call other methods and those may call (you guessed it!) further methods. When these are instrumented in Rails, the outer calls include the time to process the inner calls. The timings for the controller process_action.action_controller will therefore include all the time for the smaller pieces it calls, such as fetching and constructing model instances (sql.active_record and instantiation.active_record) and rendering the view. Rendering the view can invoke further rendering of partials and this can add to the caller’s time as well. The situation may be even more confusing if you have views that also fetch records (in general try to avoid this!).
What can we learn from this?
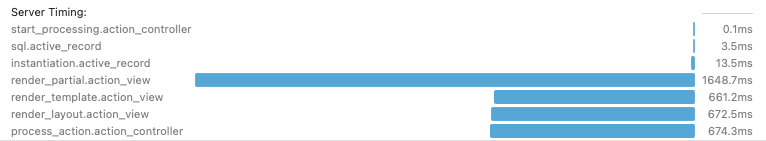
The data provided by Server-Timings is not very detailed, but it can still be enough to steer you toward the type of issue to look for and where in your code base to start looking. I’ll talk about some of the most common response speed issues a Rails developer may have to deal with. I won't go into detail on how to solve these issues since they’ve been well covered over the years in many other blog posts. To get started, we can focus our investigation on the following keys: render_template.action_view, render_partial.action_view, and sql.active_record. These correspond with “rendering templates”, “rendering partials” and “executing SQL queries”.
First, if you see that rendering templates and/or partials is very high, but the ActiveRecord component is relatively low, then you can focus the investigation on the views. Partials are known to sometimes be a less performant aspect of Rails, especially when nested, so if you see that a large proportion of the time is spent on rendering partials it makes sense to focus there. Make sure that the code uses collections to render partials when possible, as it is more efficient than calling render partial: 'foo' multiple times inside of a loop. It may also be worth looking into how deeply and how often your app’s partials are nested and maybe converting those back to larger pieces. DRY isn’t always the right choice when it comes to partials. (Note there’s currently a bug with how partial times are calculated that I’ll mention further down.)
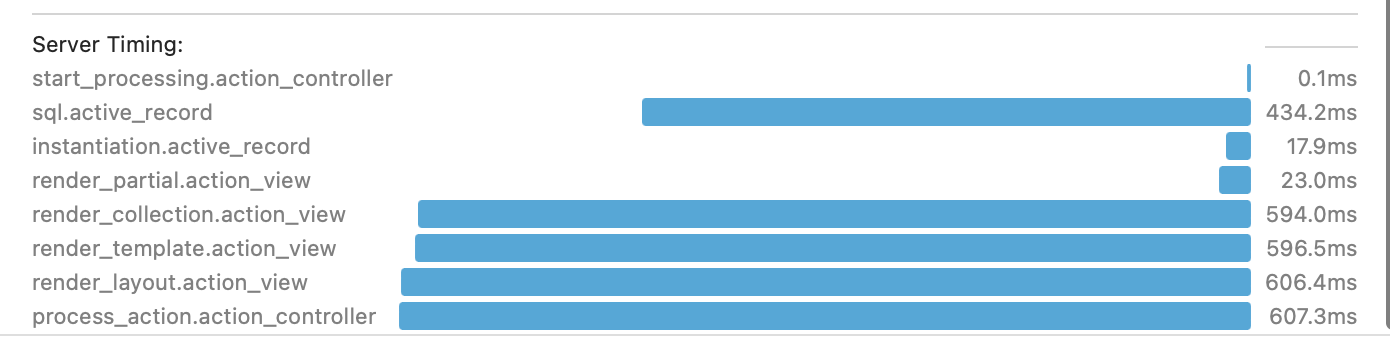
If, on the other hand, the ActiveRecord component of the request, sql.active_record, is also a large component of the time then this points to a potential issue with how the database is being queried. In this case, you might look for query inefficiencies such as N+1 lookups which sometimes occur in a view or partial that accesses an associated record that hadn’t already been fetched. Adding some eager loading to the query with #includes is a common solution. Conversely, it’s also possible that unnecessary data is being fetched and the query you’re using can be trimmed down. (Tip: I'd also suggest checking out the bullet gem to help find those in your development environment.)
Adding your own metrics
We can also add our own metrics around code in our Rails app. If I suspected something was a potential culprit I might do this so I can keep an eye on it. It's remarkably straightforward to add a new metric using ActiveSupport::Notifications.
One way I think this could be very useful is in dealing with API requests mid-response. In general, I prefer not to access an external API from my back end while responding to a request, but there are times when it's unavoidable. In those cases, I can add a timing entry by wrapping it this way:
ActiveSupport::Notifications.instrument('external-API-fetch') do
  APIService.fetch_suggestions
end
The time for this will then automatically be included in the Server-Timing header and displayed in the developer tools.
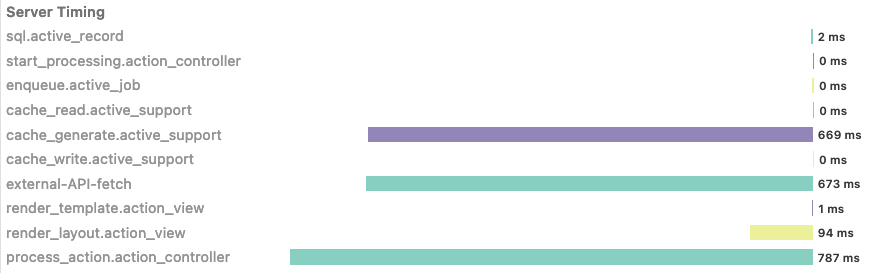
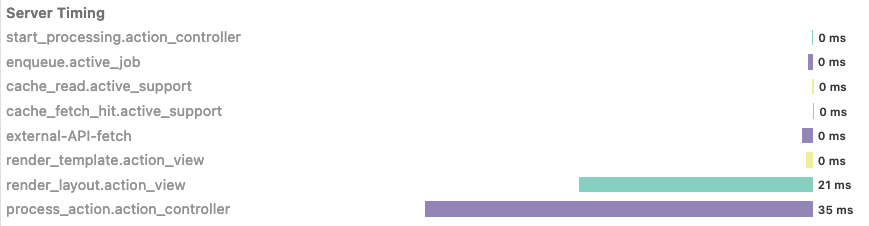
You may have spotted in the above image that I've also used some ActiveSupport caching on the API request. I’m caching responses from the upstream API so I don’t have to request them for each downstream request. That may or may not work for your request but I was thrilled to see that the effects of the caching were visible in Server-Timings without any effort on my part. It’s also pretty easy to spot the difference between a cache miss (above) and a cache hit (below).
Using Server-Timings with Other Gems
As we saw above the backend part of this feature is just using ActiveSupport::Notifications. That's great because it means we'll also get data from other gems that use it too. For example, the GraphQL Ruby gem has optional support for this.
# Send execution events to ActiveSupport::Notifications
class MySchema < GraphQL::Schema
  trace_with(GraphQL::Tracing::ActiveSupportNotificationsTrace)
end
Once you enable it in your Schema, you'll be able to get some internal metrics for GraphQL queries as well.
This might be especially useful if you've got separate front-end and back-end applications or teams. Adding onto GraphQL queries iteratively over time can sometimes result in unexpectedly poor performance. This might help a front-end team to improve the query they're using or give them something actionable to work with the back-end folks on. Support for this is also making its way into the popular ViewComponent gem and will require a similar opt-in configuration.
Wrap-up
Now that Server-Timing headers are built into Rails, they make for a very low-effort quick check for potential performance issues. In the past, I would have needed to use Skylight, New Relic, or a similar performance monitoring solution to visualize this information. To be clear, those other solutions do offer a lot more, but for a quick look, Server-Timings can often be enough. If you’re like me you probably have your browser dev tools open most of the time anyway. Server-Timings in Rails are by default available in development mode but you can opt-in in production, if you’re aware of the trade-offs. I've checked Firefox, Safari, Opera, Chrome, and even Edge; they all support showing the data, at least on OSX.
Limitations with Server-Timings
A quick summary of the limitations with Server-Timing headers in Rails:
- If you don’t see timing information make sure you’re looking at the right request. It will only show for Rails MVC controller responses. It won’t show for assets or files served from other servers. It is not on by default in the production environment.
- Inner functions are wrapped by outer ones, and the inner function's time is also included in the outer function’s timing info. You can’t get per method detail like that provided by more full-featured performance monitoring solutions.
- If looking for timing from other Gems, check their docs to see if you need to opt in.
- At the time of writing, there’s a bug with how timing data for partials is added up. See below.
One final note: While preparing this article I encountered and reported a bug in which Server-Timing for nested partials is inaccurately inflated. This most likely has to do with the timing for all partials being summed together, including partials that render other partials. I still think the information is useful as an indication of where to look, just don't take it as the exact time spent. (If your app uses a lot of deeply nested partials it can make the reported Server-Timings look like they've taken longer than the total request time.)
Hero Photo by Mingwei Lim on Unsplash
Continue the conversation.
Lab Zero is a San Francisco-based product team helping startups and Fortune 100 companies build flexible, modern, and secure solutions.
